Network Analysis of Stack Overflow Based on Developer Stories


Stack Overflow is a well-known online platform where software developers ask questions and receive answers to their technical problems. In recent years, network analysis has been a popular method for understanding the structure and behaviour of online communities, and Stack Overflow is no exception. Stack Overflow is a community for developers.
The following project was a part of my second semester where I analysed the Stack Overflow Tags. This required investigating the connections between various tags on Stack Overflow. This analysis showed which tags were frequently used together and how they are linked. Knowing these linkages may help developers better understand the programming landscape and the technologies most commonly used together. We are using GitHub Gist data.
To understand the project well and to implement it, I reviewed 10 papers and summarized those papers. The papers I selected were focused on stack overflow datasets, ego networks, methods and social network analysis, topic-based communities in social networks and more.
In this project, the Stack Overflow’s Developer Stories is defined as a graph that has been used to represent the relationships between different tags that appear in a developer’s profile. Here, the tag is related to question or answer on Stack Overflow to help categorize it and make it easier to find. Tags can be related to each other based on their meaning, usage, or relevance to a particular programming language or technology. To understand this, We are sharing an example. A developer’s profile may include tags such as “Python,” “Django,” “Data Science,” “Machine Learning,” and “Big Data.” A graph can be created by connecting these tags with edges that represent the relationships between them. For instance, there might be an edge between “Python” and “Django” to indicate that they are often used together in web development projects. Similarly, there might be an edge between “Data Science” and “Machine Learning” to indicate that they are closely related fields. By representing the tags in a developer’s profile as a graph, We visualized and analyzed the relationships between them.
To analyze the relationship, we have followed the following steps that helped us to understand.
To construct the graph in network, we initially established a blank graph. Subsequently, by traversing through the rows, we inserted the nodes and edges from the data frames ‘nodes’ and ‘edges’ into the graph.
The dataset comprises solely of a subset of tags that are employed in Developer Stories. These tags were utilized by a minimum of 0.5% of users and were found to be interrelated with another tag possessing a correlation coefficient above 0.1. As a result, the tags that are scarcely employed and those that are not employed in conjunction with other tags were sifted out.
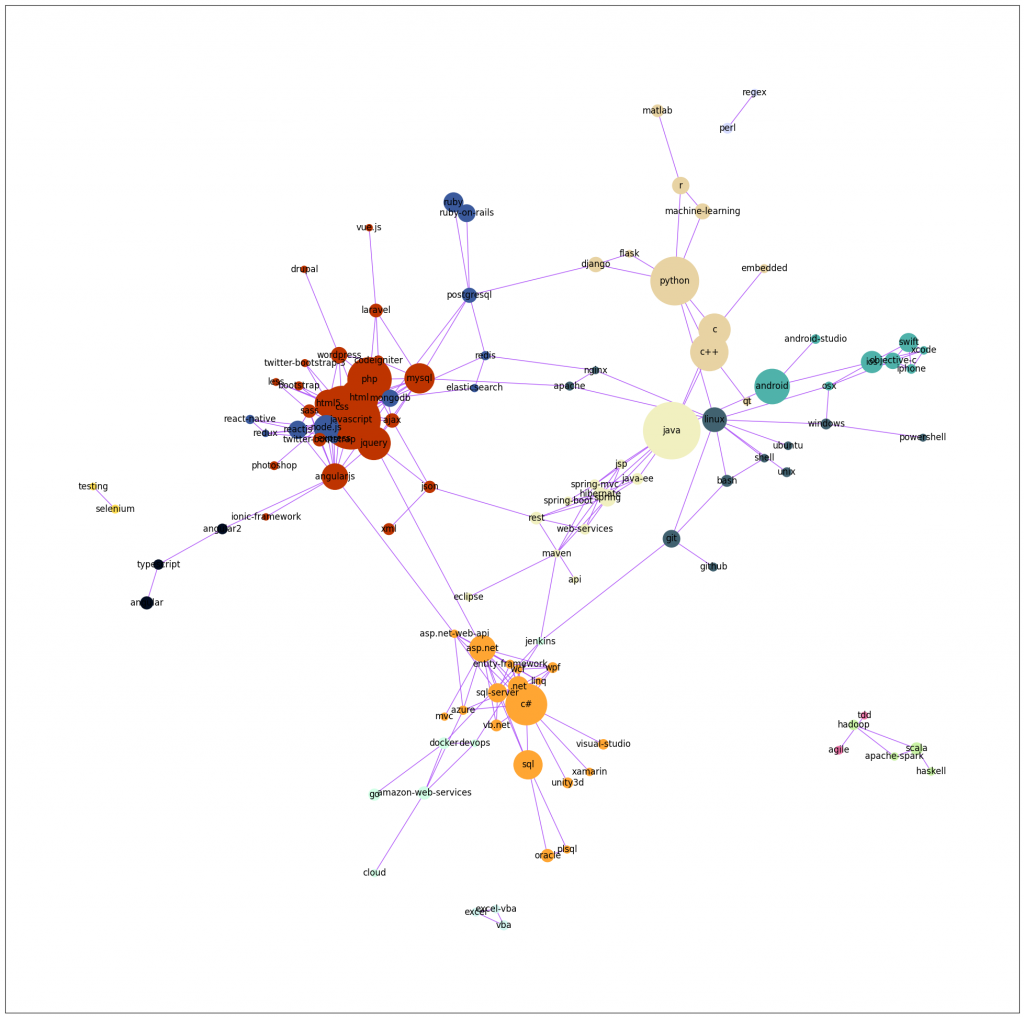
We created a network visualization using the Python network graph that is encapsulated within a user-friendly function with minor changes to the spring layout settings. We noticed that the distinguishing linked parts of the graph that we created are fa bit small, with just two or three edges, but they are still immediately recognizable.
Node size distribution refers to the frequency or distribution of nodes with respect to their sizes (e.g., number of connections or degree) in a social network. Analyzing node size distribution can provide insights into the connectivity patterns and structural characteristics of a network, such as identifying hubs or outliers. By examining the distribution of node values, we can gain a better understanding of the importance or centrality of individual nodes within the network.
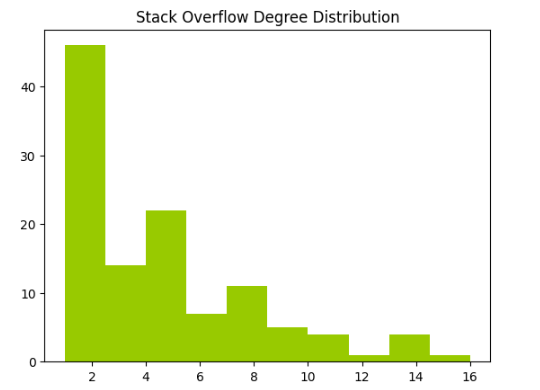
Degree distribution is the probability distribution of the degrees (i.e., number of connections) of nodes in a social network. Understanding degree distribution can reveal important information about the overall connectivity and structure of a network, such as identifying hubs, determining network robustness, and predicting information diffusion. To analyze the degree distribution of a graph, we ploted a list containing the degrees of each node. In the tag network, we observed that most tags are connected to only one or two nodes, while a few tags are connected to more than ten-tweleve nodes
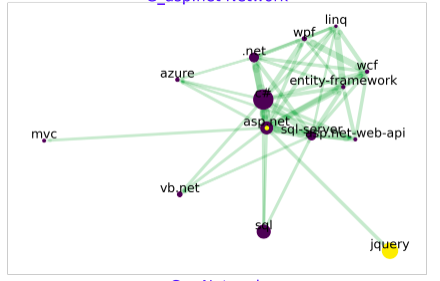
Identifying the complete Subgraph of the Main Graph: We first identified the nodes which are closely connected within the graph. That means we are identifying the clique here to extract all the cliques from the tag network.
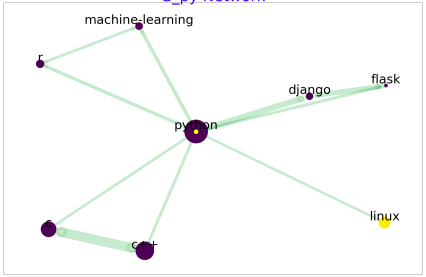
The word Ego refers to a person(node) that is connected to every node(alter), including direct neighbours in the network and an Ego Network is social network of the Ego from it’s perspective. Anyone else in that network are called “alter” – example – friends, followers, fans etc. Analyzing ego networks can provide insights into the local interactions and relationships surrounding a particular node. In this dataset, we assign each programming language with a tag in the network. For instance, the tag ‘java’ is used to refer to the Java programming language. Our analysis involved investigating the cliques that contain each programming language node in the network.
To better understand the relationships between the nodes, we visualized the ego network of each node. Here, the ego network refers to the subgraph of nodes that are directly connected to the programming language node of interest. For instance, we explored the ego network of the ‘java’ node, with a radius of 2. This means that we considered all nodes that are directly connected to ‘java’, as well as any nodes that are two connections away from ‘java in the network. By examining these ego networks, we gained a deeper understanding of the relationships between the programming languages in the dataset.
A maximal clique is a set of nodes(adjacent) in a graph where every node is directly connected to every other node in the set. In other words, it is a complete subgraph within a larger graph, where all possible edges among the nodes in the subgraph are present. Identifying maximal cliques can help in understanding the structure and dynamics of social networks, such as identifying groups of individuals with strong ties or common interests. Maximal cliques can also be used in tasks such as community detection, information diffusion modeling, and identifying influential nodes or actors within a social network. By visualizing the largest cliques, we were able to uncover some patterns in the data. To achieve this, we first identified all cliques in the dataset and sorted them based on the number of nodes they contain. This process happened in the previous two steps. We then selected the cliques with the largest number of nodes and visualized them. By focusing on the largest cliques, we were able to identify groups of nodes that are particularly strongly connected. This information chelped us to understand the structure of the network and identify clusters of related programming languages. Additionally, by examining the patterns within these large cliques, we may be able to uncover insights into the relationships and dependencies between the various programming languages in the dataset.
Identifying Top Centrality Nodes:Top 10 Important Node in the Network: Degree centrality is a measure of the importance or centrality of a node within a network. It is defined as the number of edges or connections that a node has to other nodes in the network. Nodes with a high degree centrality are considered to be more central or important within the network, as they have more direct connections to other nodes. Degree centrality is a simple but powerful measure of centrality, and it is often used in social network analysis, transportation network analysis, and other applications where understanding the flow of information or resources between nodes is important. By identifying nodes with high degree centrality, we can gain insights into the key players or central nodes within a network, and we can use this information to optimize the flow of resources or information within the network. We identified Top 10 Load centrality, in centrality, Katz centrality tags. These are different measures of centrality used in social network analysis to identify important nodes or actors within a network. Load centrality measures the amount of traffic passing through a node. In-Centrality measures the number of shortest paths passing through a node, and Katz centrality takes into account both direct and indirect connections of a node. These centrality measures can provide insights into the relative importance or influence of nodes within a social network. This helped us to Plot the top 10 important node in tag network.
Identifying Relationship of the nodes among each others: This is the stage where we analyzed which programming languages are similar and when developers put those programming languages in their stories, how they relate with each other. This step help us to identify the relationship of programming languages. This measurement help to predict and design model.
In my project, use ”stack-overflow-tag-network”
dataset available from GitHub Gist.
1) Platform Used: To perform network data analysis we used python and used Google Colab to write our code and analyze and visualize.
2) Required libraries: The libraries that we used are
networkx: a library for creating, manipulating, and analyzing complex networks or graphs.
pandas: a library for data manipulation and analysis, particularly for working with labeled data in tables or data frames.
numpy: a library for working with arrays and numerical operations in Python.
matplotlib: a library for creating visualizations and plots in Python.
seaborn: a library for creating more advanced and aesthetically pleasing visualizations than matplotlib.
scikit-learn: a library for machine learning tasks such as classification, regression, and clustering.
cv2: a library for computer vision tasks, particularly image and video processing.
random: a built-in Python library for generating random numbers and sampling from collections.
IPython.display: a library for displaying rich media in Jupyter notebooks.
Statistics: a built-in Python library for statistical calculations.
Development of the Network:
The number of connected components: 6.
The following graph shows how the network is visualized. Firstly, we define the nodes and identify the number of nodes and links.
-Number of nodes = 115
-Number of links = 490
Figure shows us how the network is looking with 30 iterations. Figure 7 shows us how the network looks with 60 iterations. The figures show
how the network is getting concentrated with the increase of iteration.
Cliques
-Clique number: 89


Leave a Reply